Essential Performance Max Reporting Guide: Metrics, Analysis, and Insights

Performance Max reporting gives you all-encompassing insights into your Google Ads campaign performance across multiple channels. You’ll track essential metricsKey performance indicators used to measure the success of affiliate marketing efforts, such as conversion rate, EPC, and ROI. like clicks, impressions, CTRThe percentage of people who click on a specific link or call to action out of the total number who view it., and conversions through the Asset Groups section, while analyzing placement data across Search, Display, YouTube, and Discovery networks. By monitoring asset performance labels (BEST, GOOD, LOW) and cross-channel trafficThis is the inflow of visitors to a page. patterns, you can optimize your campaigns effectively. Regular review of audience insights, device distribution, and conversionThe completion of a desired action by a user# such as a purchase# sign-up# or download. Conversions are the ultimate goal of most marketing campaigns and serve as a key metric for measuring success. data helps identify winning combinations and areas for improvement. Understanding these key metrics and insights will open up your campaign’s full potential.
Stop Burning Money on Failed Google Ads Campaigns!
Stop Burning Money on Failed Google Ads Campaigns!
Get instant access to the Google Ads Masterclass 2.0 – created by a $7M affiliate who actually shows REAL results. Includes proven templates, live campaign examples, and scaling strategies that work in 2025.
Understanding Asset Performance Reports
Mastering asset performance reports is essential for optimizing your Performance Max campaigns effectively. By understanding how to access and interpret your reporting dashboards, you’ll gain valuable campaign insights that drive better results. Your data monitoring journey starts in Google Ads, where you’ll find thorough performance metrics under the Assets section. Since PMax campaigns operate as a black box system, regular performance monitoring is crucial for campaign success.
To get started with data analysis and metric interpretation, follow these key steps:
- Navigate to your campaign’s Asset Groups section
- Use the Assets drop-down menu for detailed performance tracking
- Switch between table views for customized data visualization
- Enable performance indicators to evaluate asset effectiveness
Your measurement framework should focus on critical metrics like:
- Clicks, impressions, and CTR
- Conversion reporting and attribution analysis
- Cost metrics and interaction rates
- Performance labels (BEST, GOOD, LOW)
You’ll want to regularly review your performance evaluation through insight generation and reporting automation. Regular data audits help ensure your tracking and reporting remain accurate and reliable. Pay special attention to how different asset combinations perform, and use this data interpretation to optimize your campaigns. Don’t forget to leverage report customization options to focus on the metrics that matter most to your goals.
Campaign Placement Analysis
You’ll want to start your campaign placement analysis by examining how your ads are distributed across different networks, including Search, Display, YouTube, and Discovery. The placement performance metrics give you critical insights into where your ads appear and how they’re performing, helping you identify both high-performing locations and potential areas for exclusion. Impression data is provided in the placement reports to help advertisers track their ad visibility across networks. To access these reports, navigate to Predefined reports under the Reports menu in your Google Ads account.
Network Distribution Insights
Understanding network distribution in Performance Max campaigns reveals where your ads appear across Google’s vast ecosystem. With access to over 2 million sites, videos, and apps through the Google Display Network, you’ll reach potential customers at various stages of their journey. This broad distribution is essential for building brand awareness and engaging audiences effectively across the digital landscape.
The GDN offers cost-effective solutions through multiple bidding strategies to help maximize your advertising budget. You can leverage multiple targeting capabilities to refine your reach. The GDN uses contextual targeting to match your ads with relevant site content, while audience targetingThe practice of tailoring marketing efforts to reach a specific group of consumers most likely to be interested in a product or service. helps you connect with users based on their behaviors and interests. You’ll also benefit from remarketing options to re-engage previous visitors and tap into in-market audiences who are actively researching products like yours. These insights can be accessed through the Audience Manager in your Google Ads account’s Shared Library section.
To optimize your campaign’s performance, pay attention to your audience insights. These reports break down:
- Demographic data (age, gender, income)
- Geographic distribution
- Device usage patterns
- Audience segmentA division of the market based on specific demographics or characteristics. comparisons
- Behavioral indicators
Use these insights to adjust your bidding strategyA plan for determining how much to bid for ad placements in pay-per-click advertising campaigns. and create more targeted ad content. You can make data-driven decisions about which segments perform best and where to allocate your budget for maximum impact.
Placement Performance Metrics
Performance Max’s placement metrics provide critical visibility into where your ads appear across Google’s network. You’ll find these valuable insights through the Report Editor, where you can create custom placement reports to track your campaign’s presence across different platforms and websites. This data helps you evaluate the effectiveness of your Performance Max campaigns by identifying high-performing placements and areas for optimization. By leveraging these insights, you can refine your strategy to ensure your ads reach the most relevant audiences. Performance Max campaigns not only simplify multi-channel ad management but also empower you with the tools needed to maximize your campaign’s reach and ROIReturn on Investment, a key performance indicator calculated as a percentage by dividing profit by cost and multiplying by 100..
To access placement data, navigate to the Campaigns section, select Insights and Reports, and use the Report Editor. You’ll want to focus on two key columns:
- Performance Max Placement Type – Shows broad categories like webpages or mobile apps
- Performance Max Placement Details – Provides specific locations where ads appeared
When analyzing placement data, remember that these reports serve primarily as brand safety tools rather than performance indicators. You might notice:
- Limited data availability for certain inventory types
- Variations in reporting across different channels
- Missing data for some placement categories
The machine learning algorithms continuously optimize ad delivery in real-time across all placements.
To get the most extensive view of your campaign’s performance, combine placement reports with:
- Campaign-level performance metrics
- Channel-specific insights
- ImpressionThis refers to the numerous times an ad is displayed. In pop-ads, one “pop” of a webpage is counted as an impression. In display and text-link ads, an impression is counted whether or not the ad is in the viewable range. A viewable impression, on the other hand, is counted when at least 50% of […] and conversion data by placement
- Cross-channel attribution data
Understanding common interests among placements can help you discover new asset opportunities for your campaigns.
This multi-layered approach helps you understand not just where your ads appear, but how they perform across Google’s vast network.
Cross-Channel Traffic Analysis
Building on our placement metrics insights, cross-channel traffic analysis takes your Performance Max reporting to the next level. You’ll need to track and analyze how different channels work together to drive results across your campaigns. This holistic approach helps you understand the complete customer journey and optimize your marketing efforts accordingly. Bringing advertising insights into a single platform allows for more effective analysis and decision-making.
To effectively analyze cross-channel traffic, focus on these key areas:
- Channel Integration: Monitor performance across social media, email, paid search, and organic trafficVisitors who come to a website as a result of unpaid search results or other non-paid sources. through a unified dashboard
- Attribution Tracking: Implement multi-touch attribution models to understand how different touchpoints contribute to conversions
- Customer Journey Analysis: Map out the complete path from first interaction to final conversion
- ROI Measurement: Calculate return on investment across all channels to optimize budget allocation
You’ll want to consolidate data from various sources into thorough reports that showcase:
- Side-by-side channel performance comparisons
- Cost metrics (CPC, CPA, ROAS)
- Conversion trackingThe process of measuring and analyzing how many visitors to a website complete a desired action, such as making a purchase or signing up for a newsletter. across touchpoints
- Real-time analytics and KPIs
Asset Group Success Metrics
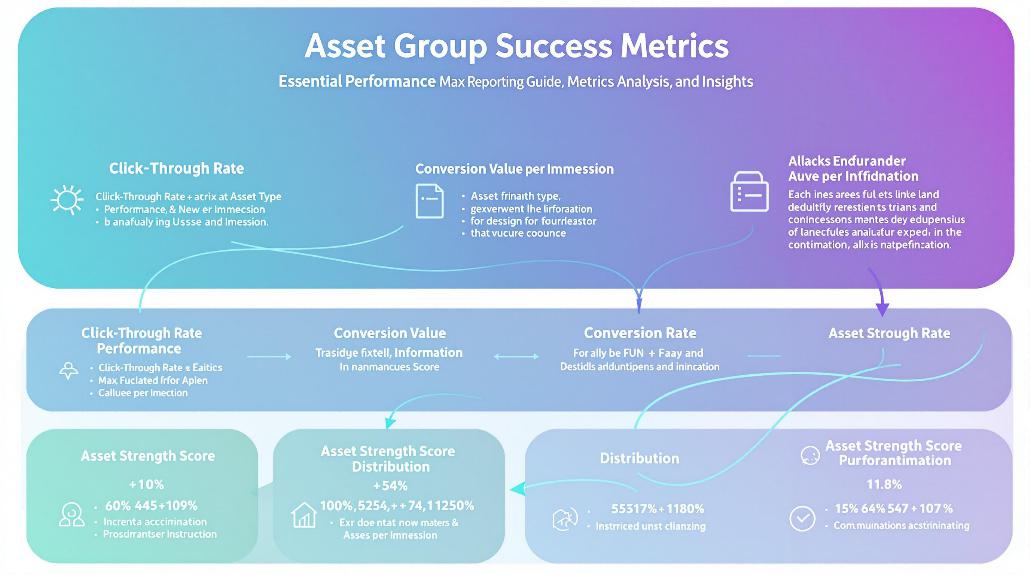
To effectively monitor your Performance Max campaigns, tracking asset group success metrics is essential across multiple key performance indicators. You’ll want to focus on fundamental metrics like impressions, clicks, and conversions while also diving deeper into sophisticated measurements like ad strength and conversion efficiency.
Key metrics you should monitor include:
- Click-throughThe user action of clicking on an advertisement or hyperlink and successfully loading the destination page. This metric is fundamental in assessing the initial effectiveness of ad creatives and promotional content. rate (CTR) to gauge ad relevance
- Cost per conversion to evaluate efficiency
- Ad strength indicators for asset optimization
- Days-to-conversion for timeline analysis
When analyzing your asset groups, pay special attention to performance across different segments:
- Device types (mobile, desktop, tablet)
- Network distribution
- Time periods for trend analysis
- Click types and user interactions
You can enhance your reporting by customizing table views to include your most important metrics. Focus on comparing top-performing asset combinations against others to identify what’s working best. Don’t forget to analyze conversion value and ROAS to understand the true impact of your asset groups on business results. By monitoring these metrics consistently, you’ll be better equipped to make data-driven optimization decisions for your Performance Max campaigns.
Product Listing Group Data
While asset group metrics offer broad campaign insights, product listing group data provides granular visibility into your product-specific performance. Your listing groups are organized hierarchically, starting with “All Products” as the base and branching into specific categories, brands, and attributes.
You’ll find several key attributes available for subdividing your products:
- Google product taxonomy categories
- Brand names
- Item IDs
- Product conditions
- Sales channels
- Custom labels (up to 5)
When analyzing your product data, keep in mind that Performance Max handles bidding automatically based on your campaign objectives. You can’t set manual bids for listing groups, but you can monitor performance through two different views:
- Listing groups tab: Shows product-level metrics
- Campaign tab: Displays overall campaign performance
Understanding URLThis is short for Uniform Resource Locator, which is commonly known as a web address. This is basically a link that a web page resolves to. It is displayed in a browser’s address bar. expansion is vital for accurate reporting. If you’ve enabled this feature, your ads may appear on additional URLs within your domain and product URLs from your Merchant Center. When disabled, ads will only show on specified Final URLs and product URLs included in your listing groups.
Performance Max Audience Insights
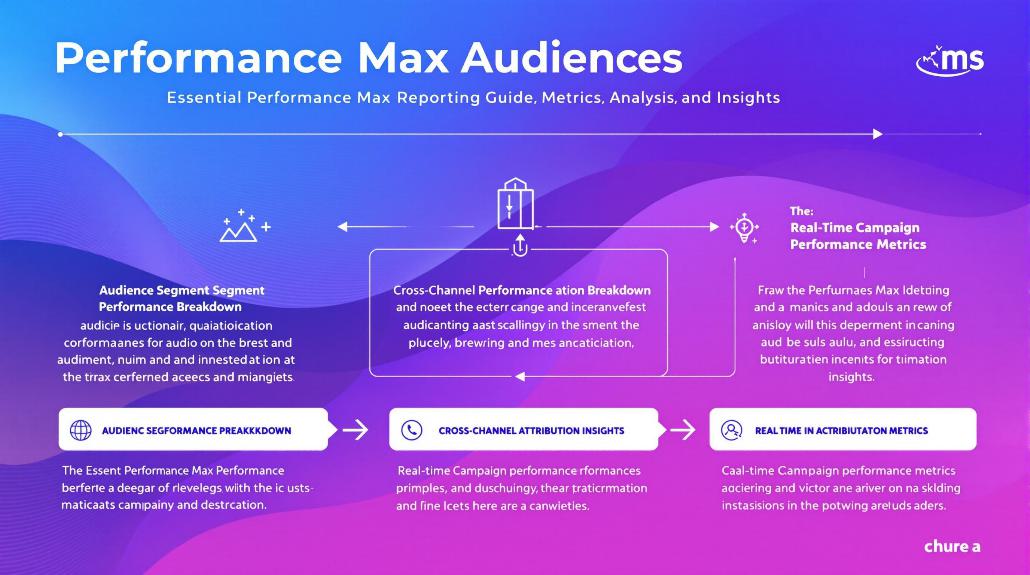
Performance Max audience insights plunge into user behavior, demographics, and conversion patterns to reveal who’s engaging with your ads and why they convert. You’ll find valuable data about your audience segments, including their interests, behaviors, and conversion likelihood, helping you make informed optimization decisions.
To maximize the value of these insights, you’ll want to regularly check your Insights page, where you can analyze detailed audience performance data. You’ll discover which segments drive the most conversions and how different demographic groups interact with your ads.
Here are key areas to focus on when reviewing your audience insights:
- Demographics and location data to understand who’s converting
- Behavioral patterns across devices and platforms
- Interest categories that align with your top performers
- Customer match list performance and opportunities
- Asset performance by audience segment
Schedule and Time Performance
Understanding when your ads perform best is crucial for maximizing your Performance Max campaign’s effectiveness. You’ll find valuable insights through the Ad Scheduling report, which breaks down performance by hour and day to help you make informed decisions about when to run your ads.
To access these insights, navigate to the Ad Scheduling section in your campaign’s left-hand menu. You can analyze your data in three key ways:
- Hour-of-day performance: Track metrics like clicks, conversions, and costs across different hours
- Day-of-week analysis: Identify which days consistently deliver the best results
- Combined day and hour view: Get granular insights into specific timeframes
While Performance Max’s algorithm automatically adjusts ad serving based on conversion data, you can still make manual scheduling adjustments to optimize your budget. Focus your spending during peak performing hours and reduce it during less effective times.
Remember to regularly monitor your scheduling data and make adjustments as needed. By combining these insights with your asset group performance and listing group analysis, you’ll develop an in-depth understanding of when your ads deliver the best results for your business.
Device Traffic Distribution
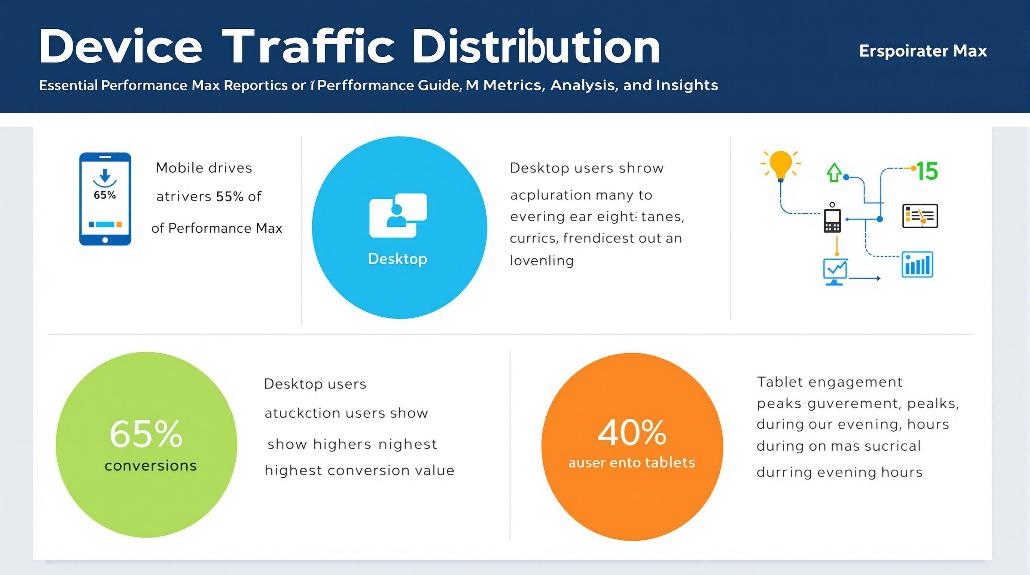
You’ll want to examine the performance differences between mobile and desktop traffic to understand how users interact with your Performance Max campaigns across devices.
While mobile traffic often dominates in terms of volume, desktop users typically show different conversion patterns and value per purchase that you’ll need to factor into your optimization decisions.
Mobile Vs Desktop Performance
Three distinct patterns emerge when analyzing mobile versus desktop performance in Performance Max campaigns. While mobile dominates in sheer traffic volume, with visits up to 313% higher than desktop, desktop users consistently demonstrate deeper engagement and higher conversion rates.
You’ll notice desktop users spend up to 79% more time per visit and view nearly twice as many pages, making them particularly valuable for complex purchases or B2B transactions.
Understanding these device-specific behaviors helps you optimize your campaigns effectively. Here are the key metrics you should monitor:
- Conversion rates: Desktop leads at 3.7% compared to mobile’s 2.2%
- Page engagement: Desktop users view 3.95 pages versus mobile’s 2.67
- Session duration: Desktop sessions last 37-79% longer than mobile
- Bounce rates: Mobile shows higher rates between 53.75-60.19%
- RevenueTotal earnings from promoting an offer, regardless of profitability. contribution: Desktop generates more despite fewer sessions
To maximize performance, focus your optimization efforts on improving mobile conversion paths while maintaining desktop’s strong performance. Pay special attention to mobile page load speeds and checkout processes, as these directly impact your campaign’s success. Remember that mobile-first indexing affects both devices, so maintaining ideal mobile performance remains essential.
Cross-Device Traffic Impact
Cross-device traffic patterns in Performance Max campaigns break down into distinct user segments, with mobile devices accounting for nearly 70% of total traffic distribution. You’ll notice that user behavior varies considerably across devices, impacting how your ads perform and convert. Comprehending these patterns is indispensable for optimizing your campaign’s effectiveness.
When analyzing cross-device impact, you should focus on these key aspects:
- Device-specific conversion rates and engagement metrics
- User journey touchpoints across multiple devices
- Impact of automated ad adjustments on different screens
- Cross-device attribution patterns
Your campaign’s success depends on how well you leverage these insights. Performance Max’s AI automatically optimizes ad placements and bidding strategies based on device-specific user behavior, helping you achieve better ROI. You’ll find that users often start their journey on mobile but complete purchases on desktop, making cross-device tracking essential.
To maximize your campaign’s effectiveness, monitor how your assets perform across different devices. While Performance Max handles most optimizations automatically, understanding cross-device traffic patterns helps you create better-targeted assets and set more accurate performance expectations.
Frequently Asked Questions
How Do Seasonal Trends Affect Performance Max Bidding Strategies Across Different Industries?
Your Performance Max bidding strategies need adjusting based on industry-specific peak seasons, like holiday retail, summer travel, or tax season, impacting conversion rates and required bid modifications.
Can Performance Max Campaigns Share Audience Data Between Multiple Linked Accounts?
You can share audience data between linked Performance Max accounts through Ads Data Hub and Audience Manager, allowing your campaigns to leverage unified customer insights and targeting signals across accounts.
What Impact Does Website Load Speed Have on Performance Max Conversion Rates?
Your website’s load speed directly affects Performance Max conversion rates – you’ll lose up to 7% of conversions for each second delay, with rates dropping from 3.05% to 0.67% between 1-4 seconds.
How Do Competitor Campaign Changes Influence Performance Max Automated Bidding Performance?
Your competitors’ bidding shifts can affect your Performance Max bidding by driving up CPCs, altering impression share, and impacting conversion rates, requiring you to adjust budgets and strategies accordingly.
When Should Advertisers Transition From Standard Campaigns to Performance Max Campaigns?
You should migrate to Performance Max when your standard campaigns underperform, you need multi-channel reach, want automated optimization, have clear business goals, and possess quality data for automation.